
A dashboard can look polished while hiding the one thing the business needs to know: whether marketing is creating profitable growth. The best marketing dashboard metrics do not simply report activity. They show where money is going, what it is producing, and which decisions will improve the next trading period.
That distinction matters. Clicks, impressions and follower growth can explain what happened in a channel, but they rarely tell a founder or CMO whether the marketing system is built to move revenue. A useful dashboard connects media performance to commercial outcomes without pretending attribution is more precise than it really is.
Key takeaways
- Start with revenue, margin and customer economics, then add channel metrics that explain movement in those outcomes.
- Use a small executive view alongside channel-level diagnostic views. One dashboard should not serve every audience.
- Treat ROAS as a channel efficiency measure, not proof of incremental business growth.
- Set targets by business model, sales cycle and margin structure. Universal benchmarks are usually misleading.
Best marketing dashboard metrics: start with business outcomes
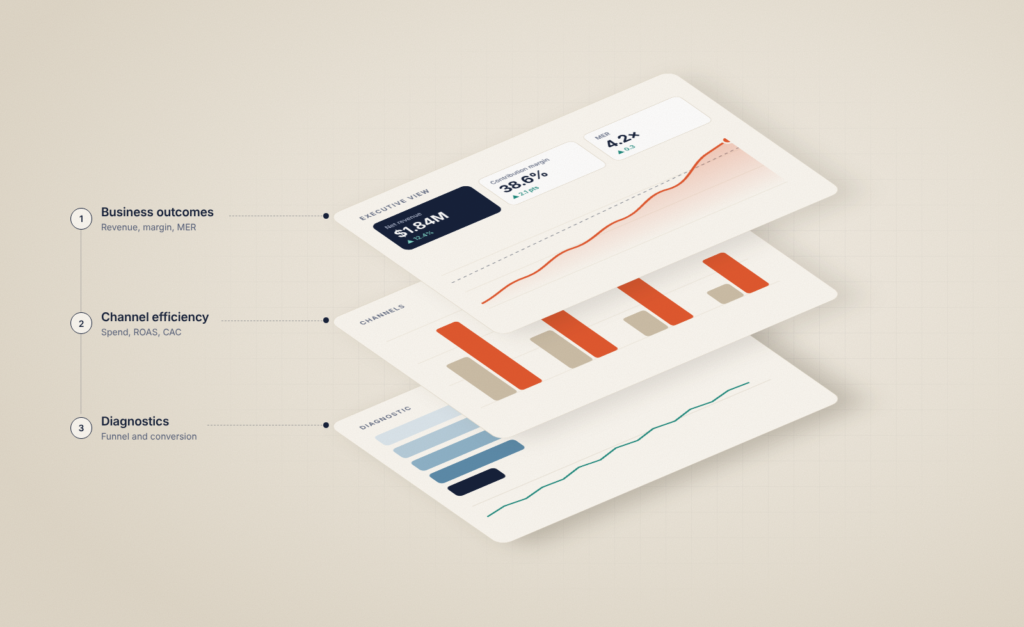
The hierarchy is simple: commercial outcomes first, marketing efficiency second, platform diagnostics third. If a metric cannot help someone allocate budget, fix a constraint or forecast performance, it probably does not belong on the main dashboard.
For eCommerce businesses, the headline outcome is usually net revenue after refunds and discounts, with contribution margin where data is available. For lead generation businesses, booked revenue or qualified pipeline is more meaningful than form submissions. A lead is not an outcome if sales cannot contact it, qualify it or close it.
The table below covers the core measures most Australian growth teams should consider. Not every business needs every metric. The right selection depends on whether growth is driven by first purchases, repeat purchases, long consideration cycles or high-value sales conversations.
| Metric | Simple calculation | What it helps decide |
|---|---|---|
| Net revenue | Gross revenue less refunds, cancellations and discounts | Whether marketing is driving realised sales, not just orders |
| Contribution margin | Revenue less variable product, fulfilment, payment and acquisition costs | Whether growth is commercially worthwhile |
| Customer acquisition cost (CAC) | Acquisition spend divided by new customers | How much can be spent to acquire a customer |
| Marketing efficiency ratio (MER) | Total revenue divided by total marketing spend | Whether the overall marketing mix is becoming more or less efficient |
| Return on ad spend (ROAS) | Attributed revenue divided by advertising spend | Which paid channels and campaigns are efficient within their measurement rules |
| Conversion rate | Conversions divided by relevant sessions or leads | Whether traffic and landing-page quality are improving |
| Average order value (AOV) | Revenue divided by orders | Whether merchandising, bundles or offers are lifting value per transaction |
| Qualified pipeline or sales-accepted leads | Count or value meeting agreed sales criteria | Whether lead volume has commercial quality |
| CAC payback period | CAC divided by monthly gross profit per customer | How quickly acquisition investment is recovered |
Revenue and margin are the non-negotiables
Revenue deserves prominence, but revenue without margin can encourage the wrong behaviour. A campaign that generates strong sales during a discount-heavy period may look excellent in an advertising platform while producing little incremental profit after freight, returns and promotional costs.
Where finance data is not yet available in the dashboard, use net revenue as an interim measure and make the limitation explicit. Do not label a revenue metric as profitability. That small act of precision prevents poor budget decisions.
For subscription, membership and repeat-purchase brands, track revenue cohorts as well as total revenue. A low first-order CAC may be attractive, but only if those customers repurchase at a rate that supports the initial investment.
CAC, LTV and payback should work together
CAC becomes dangerous when it is read in isolation. A $120 CAC could be excellent for a customer who generates $800 in gross profit over time, and unacceptable for a customer who buys once and never returns.
Lifetime value (LTV) is useful only when it is based on observed behaviour and sensible cohort windows. Forecasted LTV can be valuable for planning, but it should not be used as an excuse to tolerate unproven acquisition losses. Pair it with CAC payback period, which is often easier for executives to act on: how long until the gross profit from a new customer covers the cost of acquiring them?
For high-consideration B2B, replace immediate LTV with pipeline value, win rate and sales-cycle length. The dashboard should reveal whether marketing is creating opportunities that progress, rather than simply feeding a CRM with names.
Use efficiency metrics without being misled
MER and ROAS are often grouped, but they answer different questions. MER is an overall business-level signal. It captures the combined effect of paid media, brand demand, organic search, email, creative, pricing and seasonality. It is less granular, but harder to game.
ROAS is more tactical. It can help decide which campaigns, audiences or products deserve more investment, provided the attribution model is understood. Platform-reported ROAS is not an independent truth. It is a measurement output shaped by tracking coverage, attribution windows, view-through settings and each platform’s incentive to claim credit.
This does not make ROAS useless. It means it needs context. If paid search ROAS rises while total revenue, MER and new-customer volume remain flat, the likely explanation may be stronger capture of existing demand rather than additional demand creation.
A practical rule is to show ROAS beside spend, new customers and a business-level outcome. That combination makes it harder to optimise a channel into a corner.
Build the dashboard in three decision layers
An executive dashboard should be brief enough to review in minutes. It needs total spend, net revenue, contribution margin or margin proxy, MER, CAC, new customers, qualified pipeline and a clear comparison against target and prior period.
The second layer is a channel performance view. Break down spend, conversions, CAC or cost per qualified lead, revenue, ROAS and conversion rate by channel. This is where budget allocation decisions happen. Keep channel definitions consistent so paid social, paid search, email, organic search and referral traffic are not being compared using incompatible conversion logic.
The third layer is diagnostic. It answers why a headline metric moved. For an eCommerce team, this may include product-level conversion rate, stock availability, checkout abandonment, discount use and returning-customer rate. For a lead-generation team, it may include landing-page conversion rate, response time, lead-to-opportunity rate, opportunity-to-win rate and revenue by source.
Trying to squeeze all three layers into one screen produces clutter, not clarity. Different roles need different levels of detail.
Define the metrics before automating them
Most dashboard problems are governance problems disguised as reporting problems. A CRM may record a lead when a form is submitted, while the sales team calls only contacts that meet a separate qualification standard. An ad platform may count a purchase at the confirmation page, while finance recognises revenue after an order ships. Both figures can be valid, but they are not interchangeable.
Create a short metric dictionary covering the name, formula, source system, owner, reporting lag and known limitation for every executive metric. Agree on what counts as a new customer, qualified lead, marketing spend and revenue. This is less glamorous than dashboard design, but it is where trustworthy reporting begins.
Use a consistent comparison frame as well. Week-on-week views are useful for rapid optimisation but are vulnerable to day-of-week effects. Year-on-year comparisons are often stronger for seasonal Australian businesses. A rolling four-week view can reduce noise when spend and conversion volume are uneven.
What changes in 2026
Measurement is becoming less about finding a perfect user-level path and more about building a reliable decision system from imperfect signals. Consent choices, browser restrictions, fragmented customer journeys and AI-mediated search experiences all reduce the value of simplistic last-click reporting.
That shifts attention towards first-party data quality, server-side event collection where appropriate, CRM integration, cohort analysis and controlled testing. The dashboard should include data-quality checks such as tracked revenue versus finance revenue, CRM source completion and the share of conversions with consented measurement. These are operational metrics, but they protect the commercial metrics above them.
For larger budgets, incrementality testing can validate whether an apparent channel winner is actually creating additional revenue. This can involve geographic tests, audience holdouts or carefully managed spend experiments. It is not necessary for every business, but it is more credible than assuming every attributed conversion would disappear without the ad.
The dashboard test that matters
Before adding any metric, ask one question: what decision changes if this number moves? If there is no clear answer, remove it from the main view.
A marketing dashboard earns attention when it creates better conversations between marketing, sales and finance. Keep the scorecard commercially anchored, make attribution limitations visible, and review the story behind the numbers before moving the budget. That is how reporting becomes a measurable growth system rather than a monthly performance theatre.