
A customer journey map is not a decorative workshop output. It is a working model of how demand becomes revenue, where customers lose confidence, and which teams own the moments that decide the sale. This customer journey mapping guide is built for growth teams that need to turn customer insight into sharper acquisition, better conversion rates and stronger retention.
The commercial case is straightforward. Salesforce’s 2024 State of the Connected Customer research found that 73% of customers expect companies to understand their unique needs and expectations. Yet most businesses still plan campaigns, websites, CRM flows and customer service operations in separate lanes. The customer experiences one business. Your internal structure should not become their problem.
What a customer journey map should achieve
A journey map documents the steps a defined customer takes to complete a meaningful job: researching a product, requesting a quote, making a first purchase, renewing a contract or resolving an issue. It combines observable behaviour with the context behind that behaviour – intent, questions, concerns, channels and decision criteria.
The output should help leadership make choices. It should identify where spend is being wasted, where prospects need better information, where handovers break down and which changes have the greatest likely effect on revenue. If a map cannot inform a decision about investment, messaging, experience or measurement, it is too abstract.
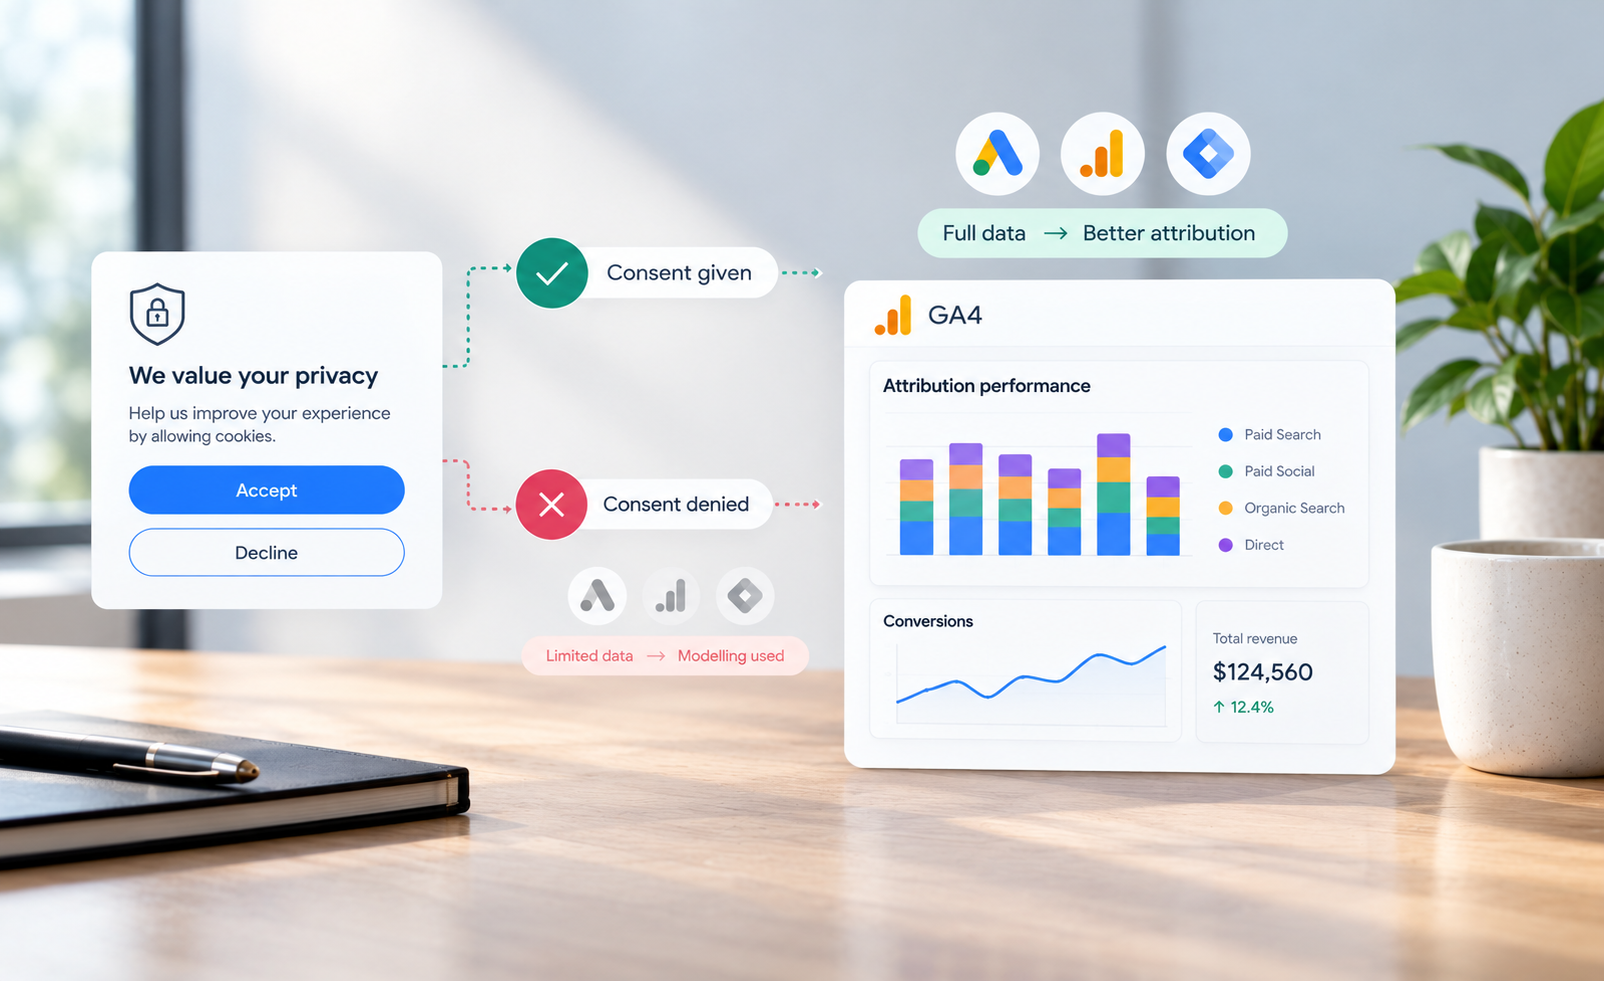
This matters particularly for Australian businesses with longer consideration cycles. A prospective customer may see a paid social ad, compare options through Google, read reviews on mobile, ask colleagues for validation and submit a form weeks later. Last-click attribution will often credit the final search. A journey map gives the earlier interactions their proper strategic role without pretending every touchpoint has equal value.
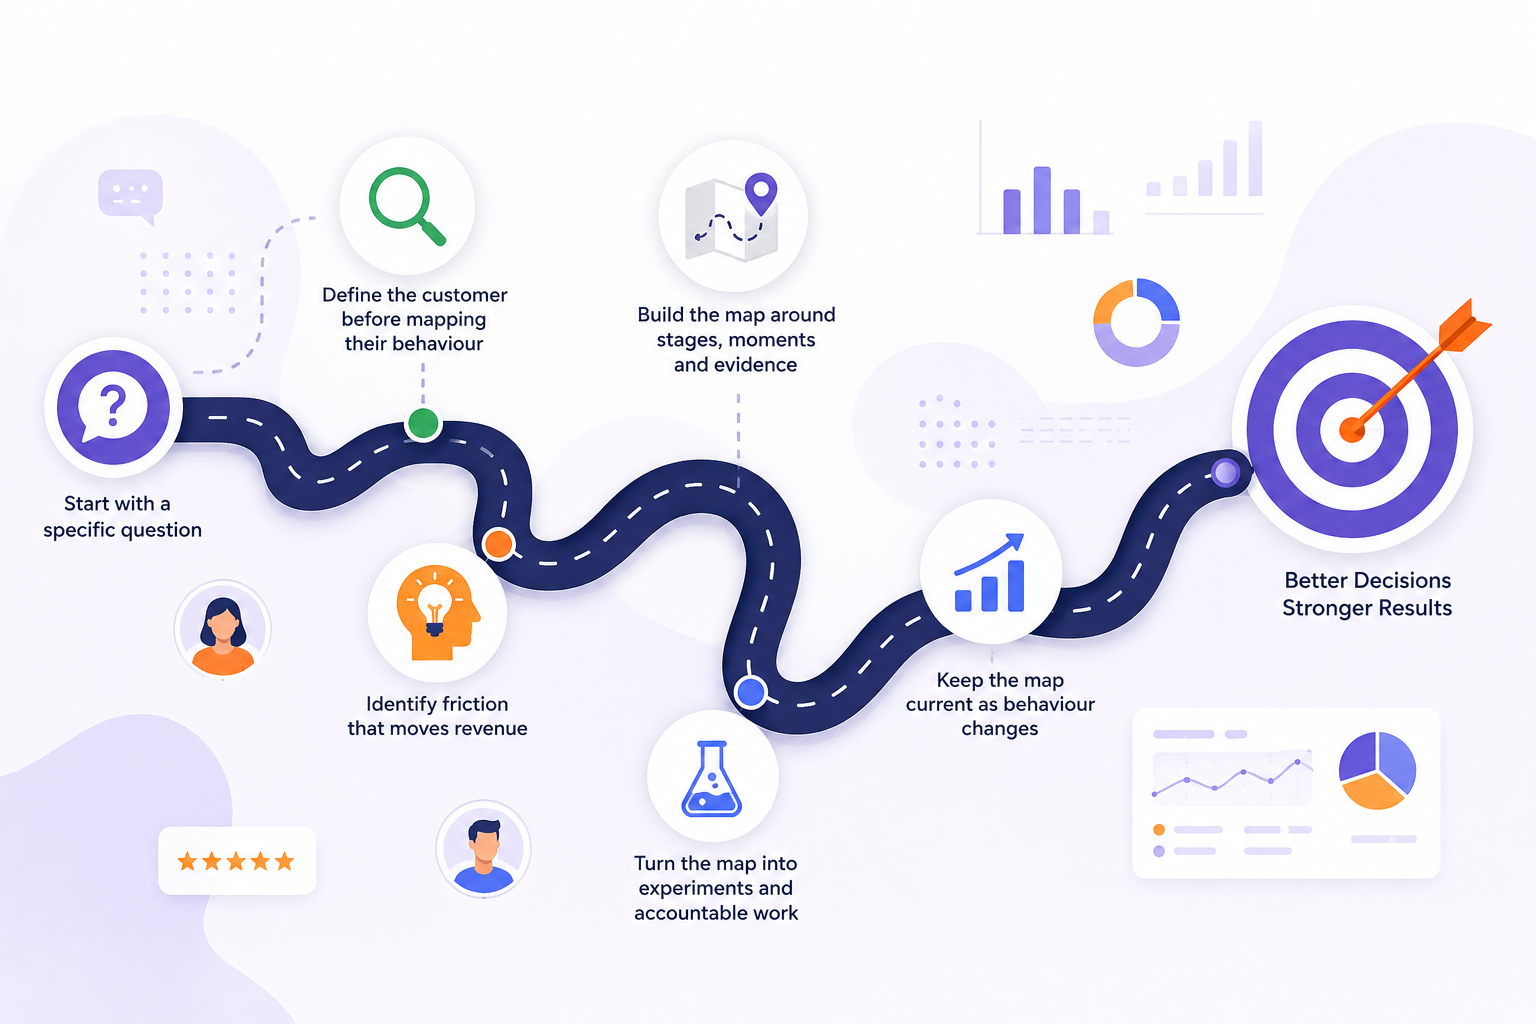
Start with a specific commercial question
Do not map every audience, product and channel at once. That creates a wall of sticky notes and very little direction. Begin with one journey that affects a business priority, such as:
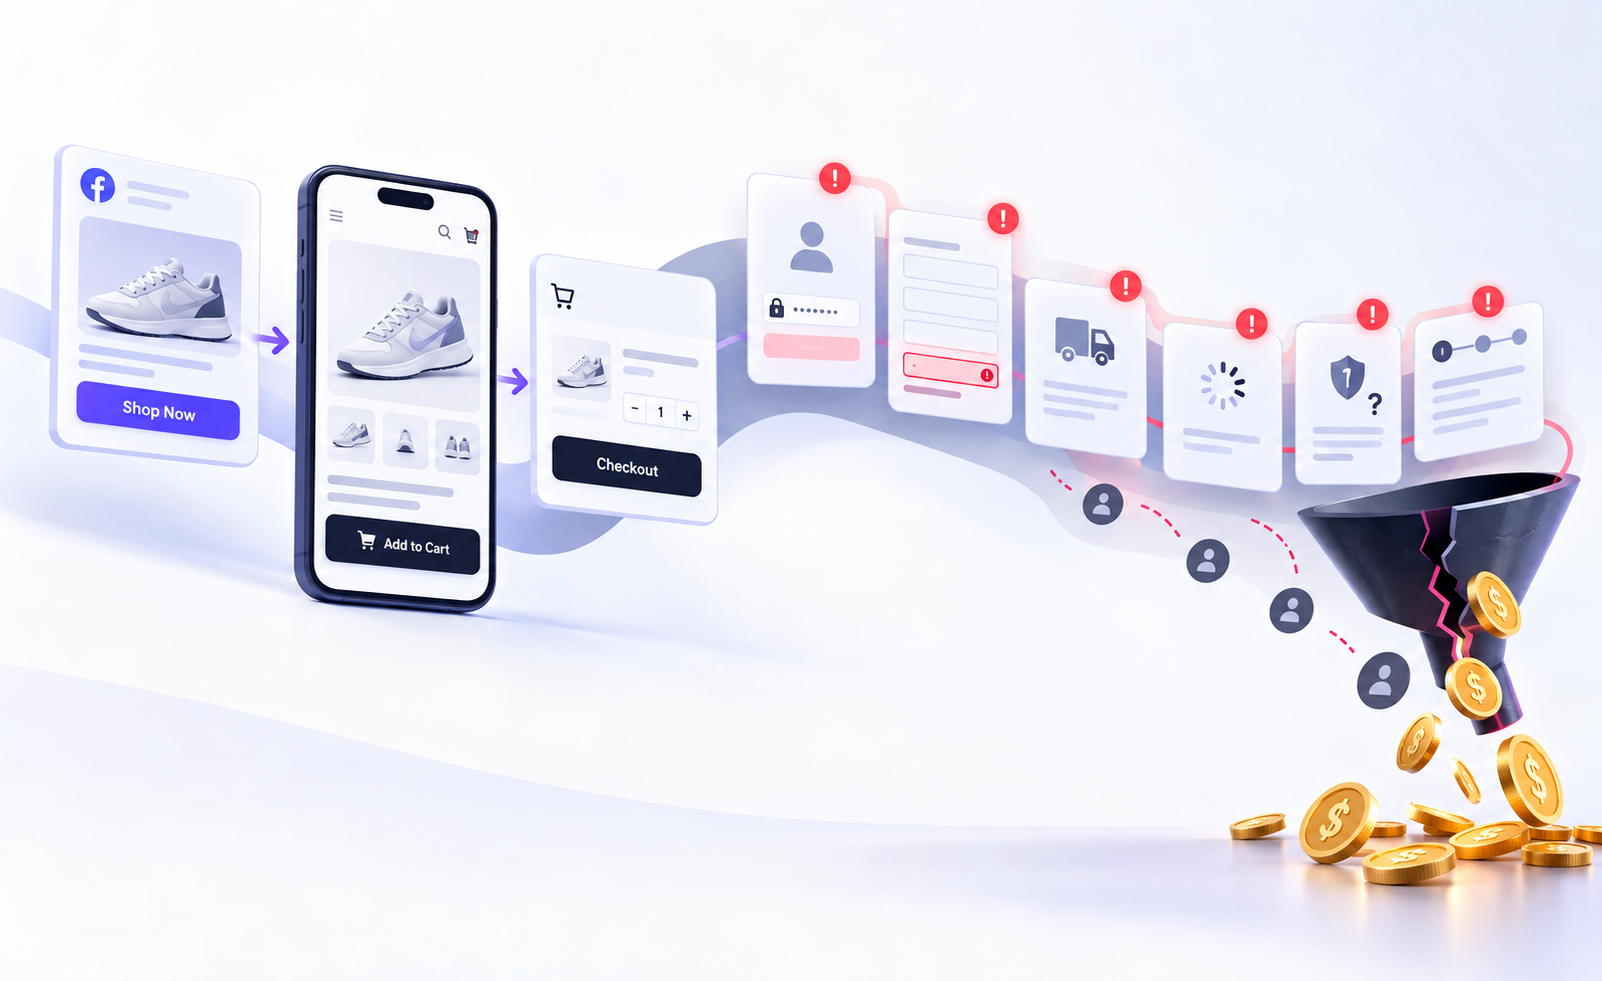
- reducing cart abandonment for a high-margin category
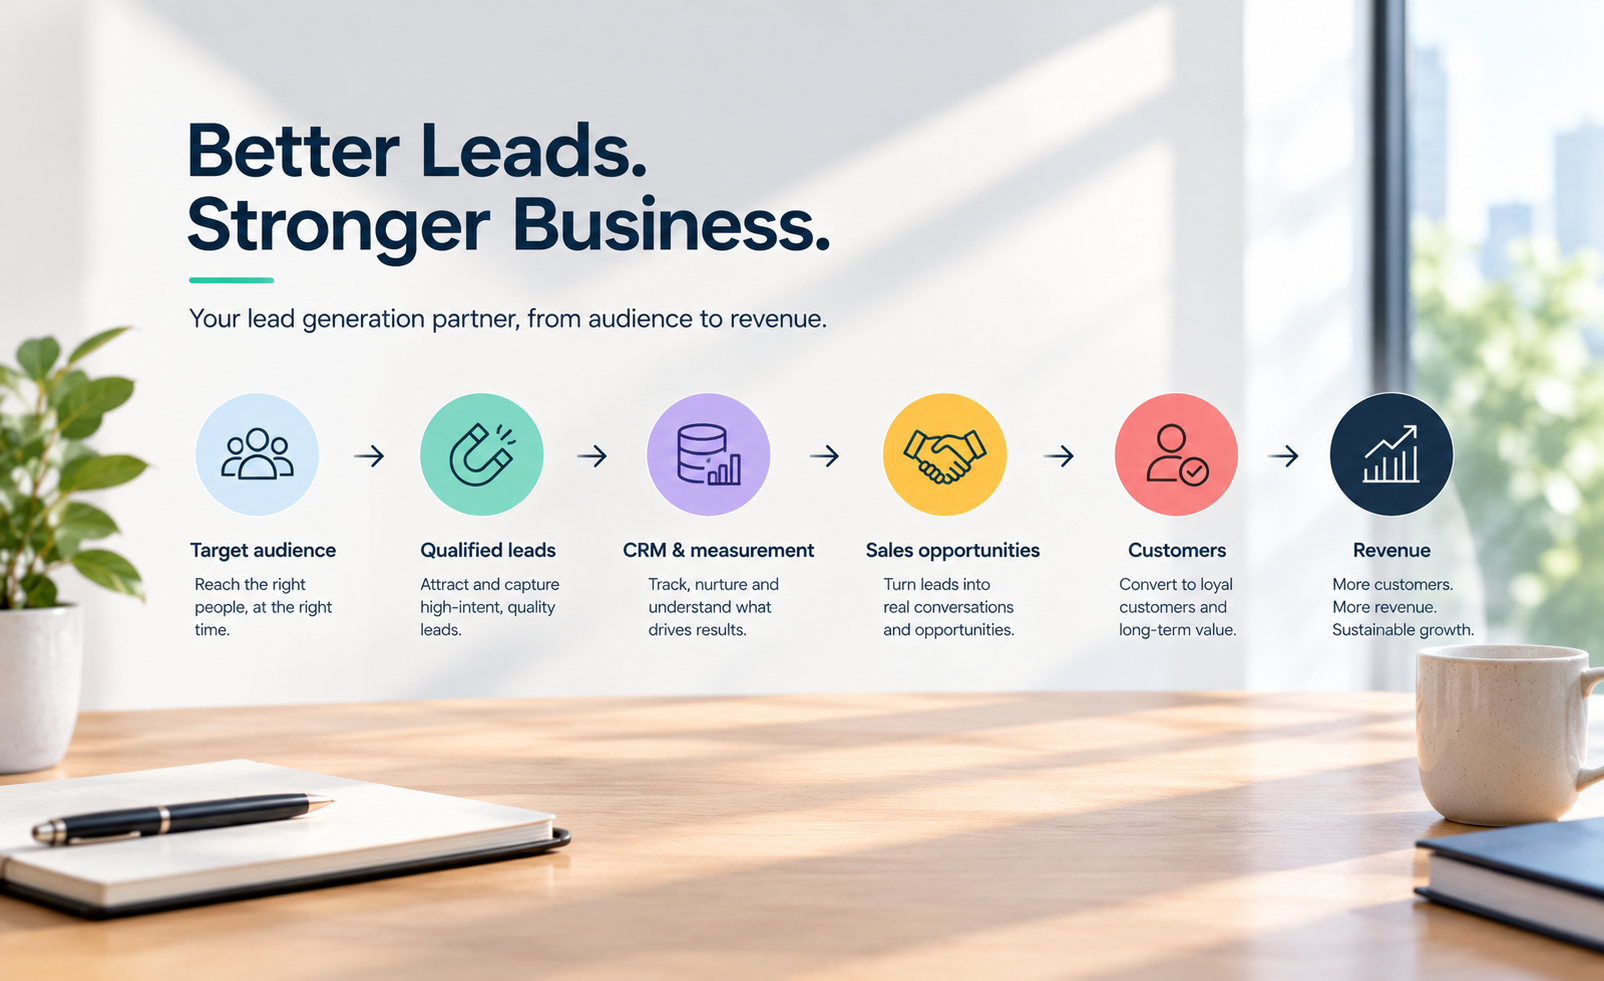
- improving qualified lead-to-sale conversion
- increasing repeat purchase within 90 days
- shortening the time from demo request to first value
A useful framing is: how does a particular customer segment move from a defined trigger to a valuable outcome, and what stops them along the way?
For example, an Australian eCommerce retailer might map first-time shoppers buying a considered product over $300. The job is not simply to buy an item. It may be to feel confident the product is right, will arrive when needed and can be returned without hassle. That distinction changes the work. Product specifications and delivery clarity may matter more than the ad that brought them there.
Define the customer before mapping their behaviour
A map built around a vague persona such as “small business owners” will produce generic recommendations. Segment by factors that change the journey: purchase motivation, urgency, industry, customer maturity, location, order value or acquisition source.
For B2B, separate the day-to-day user from the economic buyer when their concerns differ. The operations manager may want faster reporting; the finance lead may need proof of payback and lower risk. For eCommerce, first-time buyers and returning customers should rarely share a map. They enter with different levels of familiarity and trust.
Use evidence, not assumptions, to define the segment. Customer interviews reveal language and objections. Search query data shows what people are actively trying to solve. CRM records show sales-cycle patterns. Web analytics exposes page paths, device behaviour and drop-off points. Support tickets and reviews can reveal friction your marketing dashboard cannot see.
No single source is sufficient. Interviews explain why, analytics shows scale, and sales or service records test whether the issue has commercial consequences. This is where a data-grounded digital marketing strategy becomes essential.
Build the map around stages, moments and evidence
Most journeys can be organised into five broad stages: trigger, research, evaluation, conversion and post-purchase. Those labels are only a starting point. The real value comes from documenting what happens within each stage.
For every stage, capture the customer’s goal, actions, questions, channels, emotional state, friction points, business owner and available evidence. Add the metric that indicates whether the stage is working. This turns a descriptive diagram into an operating tool.
| Journey element | What to document | Useful evidence |
|---|---|---|
| Customer goal | The progress they want to make | Interviews, sales calls, search terms |
| Actions | Pages viewed, calls made, products compared | Analytics, CRM and session recordings |
| Questions | Information needed to proceed | On-site search, chat logs, reviews |
| Friction | Confusion, delay, risk or effort | Exit surveys, support tickets, funnel data |
| Business response | Content, experience or follow-up required | Audits of pages, ads, email and service |
| Success metric | The behaviour that signals progress | Conversion rate, lead quality, repeat rate |
Map moments of truth in greater detail than routine interactions. A pricing page, delivery estimate, booking form, product comparison page or first onboarding email can carry far more commercial weight than a generic social post. The priority depends on the category and customer intent, which is why evidence matters.
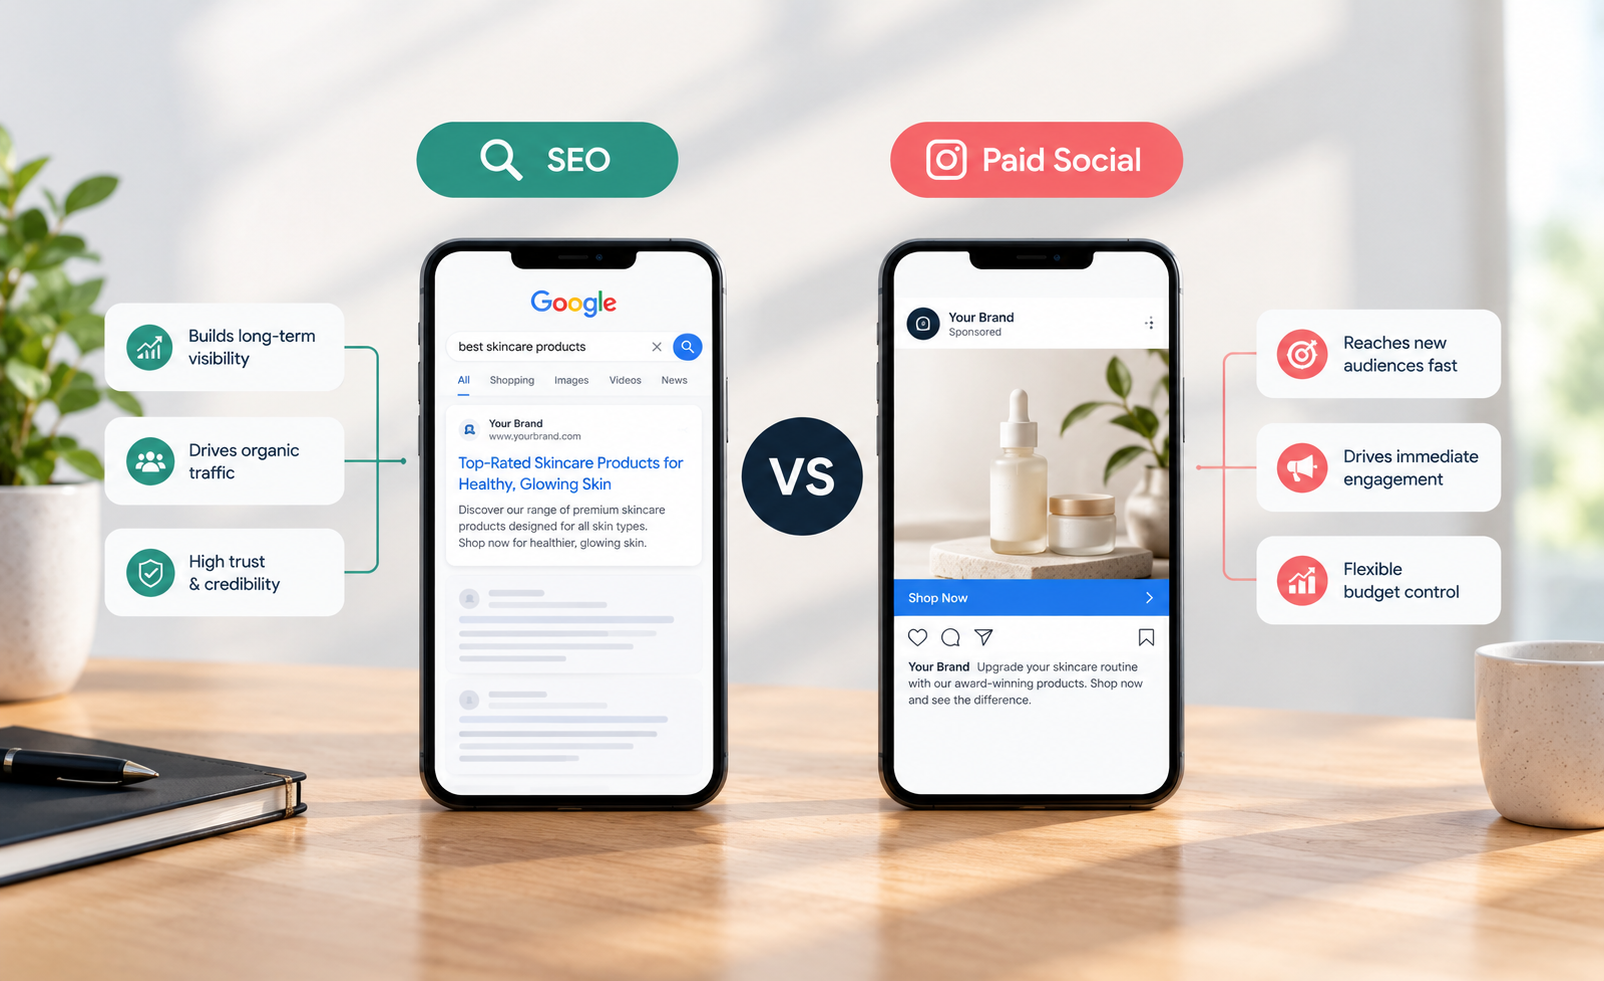
This is particularly true for conversion rate optimisation – the highest-leverage moments are where friction directly blocks revenue. In the research stage, many customers validate options through organic search results without sales pressure, making SEO visibility a revenue-critical part of the journey map.
Find friction that actually moves revenue
Not every irritation deserves a major project. A map should distinguish between noticeable friction and friction that changes outcomes.
Start by comparing qualitative signals with funnel data. If interviews show buyers are unsure about installation, and the relevant product page has high exits or support contacts before purchase, you have a stronger case for action. If customers complain about a minor visual preference but conversion and retention remain strong, it may not be the next priority.
Then score opportunities using three dimensions: expected commercial impact, confidence in the evidence and implementation effort. A simple prioritisation formula is:
Priority score = impact × confidence ÷ effort
The numbers do not need false precision. A one-to-five score is enough to force a useful discussion. A pricing-page rewrite informed by call recordings may score highly because it is relatively quick, supported by evidence and affects a high-intent audience. Rebuilding an entire website may have greater theoretical upside but lower confidence and far higher effort.
There is a trade-off here. Removing every possible decision point can make an experience feel simplistic for high-consideration purchases. Buyers of complex services may need detailed documentation, proof and access to a human expert. The aim is not fewer steps at any cost. It is less unnecessary effort and more confidence at the moments where commitment is required.
Turn the map into experiments and accountable work
Journey mapping fails when it ends in a presentation. Convert each priority into a clear hypothesis, owner, measurement plan and review date.
A practical hypothesis might be: “If we place delivery cut-off times and returns information beside the add-to-cart action for regional customers, completed checkout rate will increase because uncertainty is resolved before payment.” The owner might sit in eCommerce, while marketing supplies the messaging and analytics validates the result.
Avoid measuring only the nearest micro-conversion. A lead form change that increases submissions but lowers sales-qualified leads is not a growth win. Tie testing to the deepest reliable outcome available: revenue, gross profit, qualified pipeline, activation or repeat purchase. Where sales cycles are long, use leading indicators but validate them against eventual commercial results.
This experimentation approach is central to performance marketing strategy – testing hypotheses that move measurable business outcomes.
This is also where measurement discipline matters. Establish a baseline, define the audience included in the test and account for factors such as promotions, stock availability, seasonality and channel mix. A journey map can reveal the right problem; controlled experimentation is what tells you whether the proposed fix worked.
Keep the map current as behaviour changes
Customer journeys are not static. Search behaviour changes, new AI-assisted discovery surfaces emerge, competitors alter their offers and customers adopt different expectations around speed and self-service. Review high-value maps quarterly, and refresh them whenever there is a major change to pricing, product range, website architecture or acquisition strategy.
Treat the map as a shared planning asset across marketing, sales, product and service. Each function sees a different slice of the customer experience. Bringing those slices together often exposes the real constraint: not a lack of traffic, but weak message match; not poor lead volume, but slow follow-up; not low demand, but unresolved risk at checkout.
The most valuable journey maps create a habit of asking better questions before buying more media. If the evidence points to a revenue-critical break in the experience, fix that break first. A digital growth strategy built on customer insight beats volume-focused acquisition every time.
Ready to map your customer journey and identify where revenue is being left on the table? Request a consultation to get started.